

Data-driven rationale for controlled kiosk lighting
Design decisions for retail kiosks must be supported by objective measurements rather than intuition. A lab protocol that centers on photometric analysis and lux distribution reduces trial‑and‑error on the sales floor and aligns display output with real usage scenarios such as those found in large complexes using shopping mall signage. Employing measured metrics ensures that branding content appears consistent across units and viewing angles, and that hotspots do not compromise legibility or perceived quality.

Standards and the single anchor
Use the Illuminating Engineering Society (IES) as the practical anchor: recommended retail general lighting levels commonly fall in the 300–500 lux range, which provides a useful baseline for kiosk integration. Translate that baseline into target lux values on the display surface rather than ambient ceiling values. Key parameters to record include lux distribution, luminance (cd/m²), and uniformity ratio; these terms form the measurable vocabulary of the procedure and permit direct comparison across designs and suppliers.
Lab setup and essential instrumentation
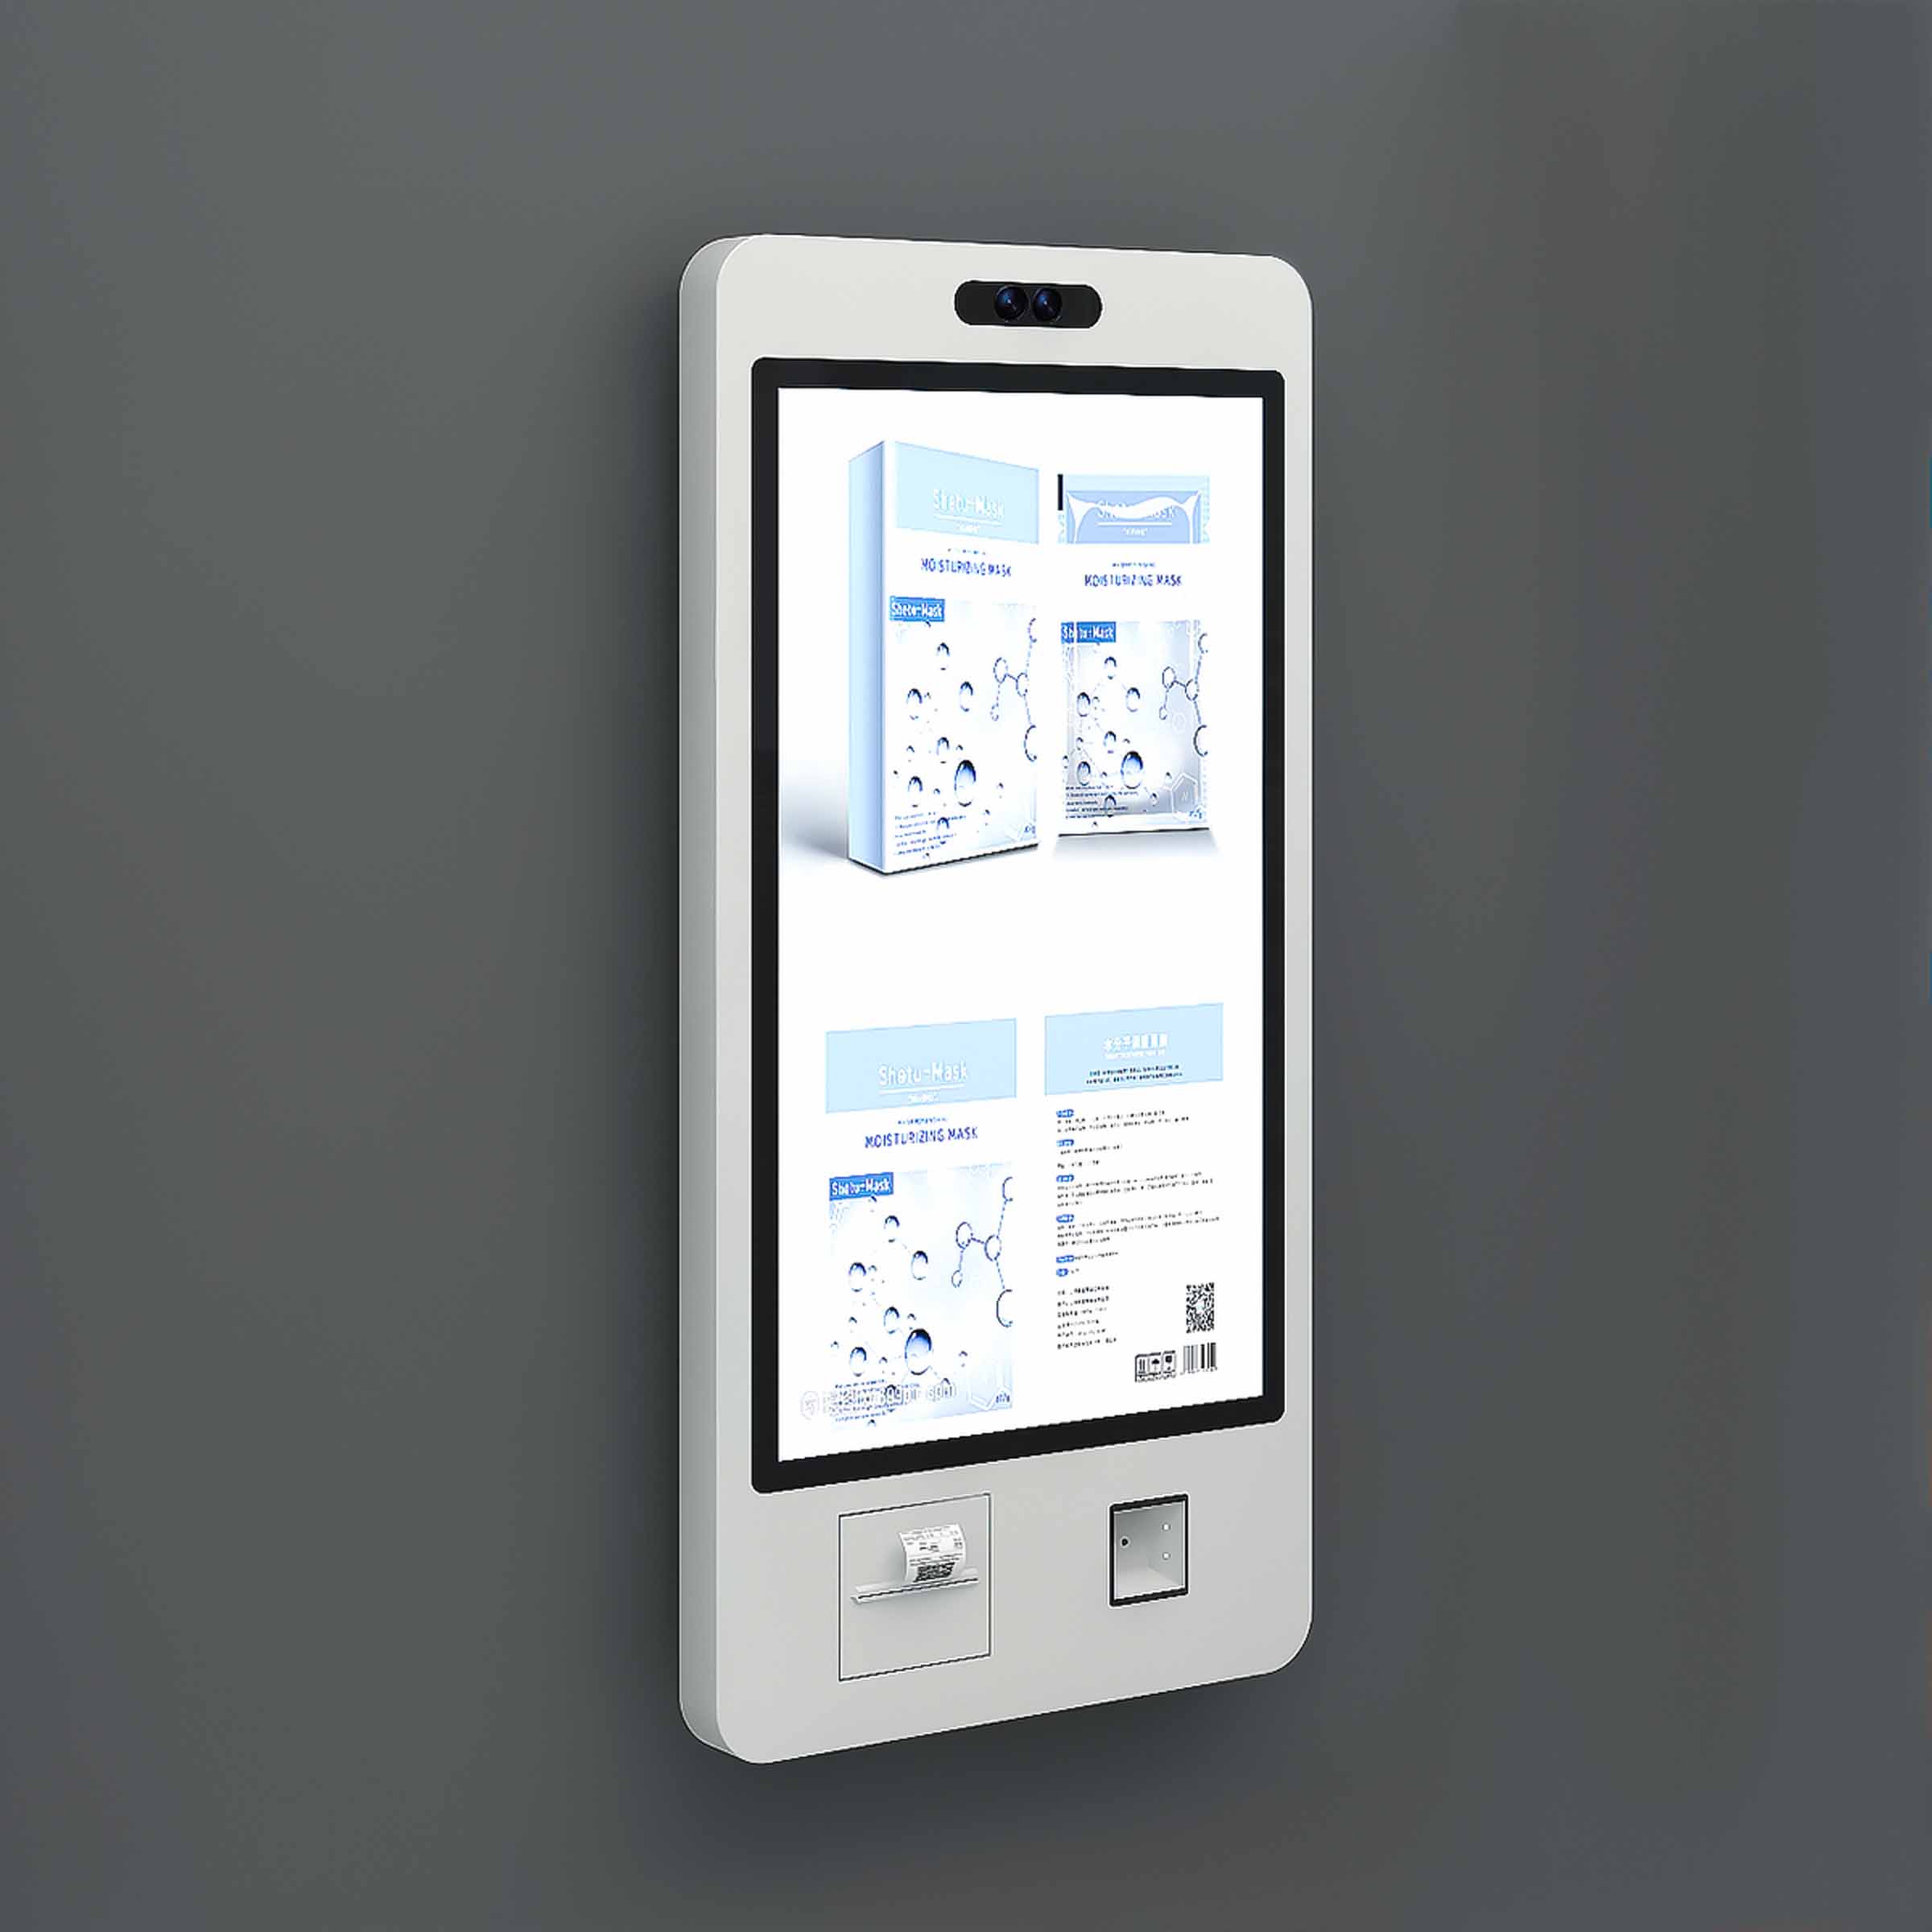
Assemble a controlled test fixture: darkened enclosure, calibrated lux meter, imaging photometer or luminance camera, and a stable power source for the display and LED driver. Mount the kiosk at a fixed observer distance and document viewing zones. Record lux distribution across a grid (typically 9–25 points) on the screen plane to derive a uniformity ratio (minimum/maximum). Capture full‑field luminance maps to locate hotspots and to quantify their peak values and spread.
Stepwise procedure for hotspot elimination
1. Establish baseline: measure ambient and on‑screen lux, capture initial luminance map.
2. Isolate backlight variables: modify diffuser layers, adjust LED pulse‑width modulation, and test alternative LED drivers while remeasuring. Small changes in diffuser thickness or texture can shift luminance gradients significantly.
3. Iterate optical engineering: test micro‑prismatic films or secondary diffusers to reduce local maxima without lowering average luminance. Optimize LED array placement to avoid concentrated emission—this is often the root cause of hotspots.
4. Validate across angles: measure at ±30° and ±45° to ensure that off‑axis viewing does not introduce new hotspots due to angular luminance peaks.
These steps establish a repeatable sequence for product development and supplier validation. — Minor tradeoffs will be necessary: slightly reduced peak brightness may improve perceived uniformity and overall readability.
Common mistakes, alternatives, and practical tradeoffs
A frequent error is relying on a single point lux reading at the screen center; this masks peripheral hotspots and misrepresents user experience. Another pitfall is optimizing for maximum luminance without controlling spatial variance—resulting displays look harsh and uneven under retail lighting. Alternatives include computational ray‑tracing in early design and using modular diffuser stacks in prototyping. For deployed solutions in busy malls, integrate sensor‑based adaptive dimming to maintain target lux distribution under varying ambient conditions; this approach complements static optical improvements and links naturally with broader digital signage for shopping mall strategies.
Advisory: three evaluation metrics to prioritize
1. Uniformity ratio (min/max luminance): target ≥0.7 for commercial kiosks to ensure consistent appearance across the display.
2. Peak hotspot delta (peak luminance ÷ mean luminance): maintain below 1.6 to prevent localized glare that draws user attention away from content.
3. Angular stability: measure luminance at defined off‑axis positions; ensure less than 15% variance between ±30° views to preserve readability for standing and seated users.
These metrics yield clear pass/fail criteria for engineering teams and procurement; they convert subjective impressions into contractable specifications. Final validation should always occur under the representative ambient conditions expected in deployment—shopping centers vary, and so should your test profiles.
Cosun Sign provides configurable modules and documented photometric data that align with these laboratory benchmarks—practical support when you translate lab outcomes into field deployments. Practical competence, measured outcomes, and a supplier that documents both—there is your assurance.
—